
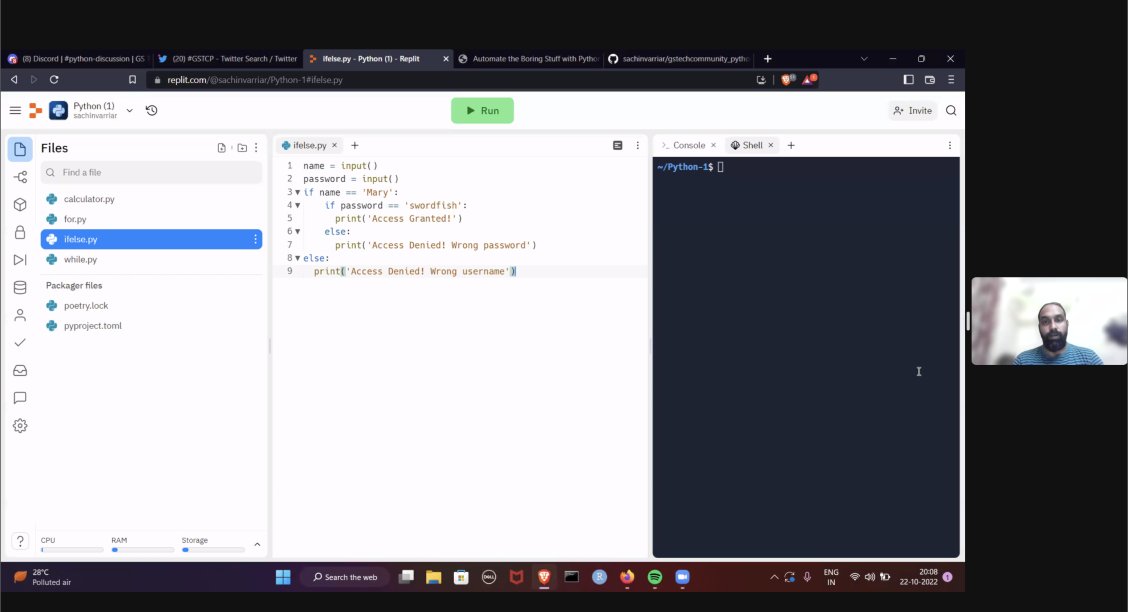
I’m continuing my association with GrowthSchool’s data science community.
Join me tomorrow 22 oct 2022 at 8 pm ist to learn about python programming. I’ll be talking about some basics of python and control flows like loops, conditional statement
https://lnkd.in/dkbevKFB
Register now
#python #datascience

I am happy & excited to share that i will be starting my journey of learning Python from scratch inside Tech Community at @growthschoolio
It's as fun & learning as it can be..
Is this something that interests you?
Signup here 👉🏻 bit.ly/3ASvNf6
#GSTCP

I am happy & excited to share that i will be starting my journey of learning Python from scratch inside Tech Community at @growthschoolio
It's as fun & learning as it can be..
Is this something that interests you?
Signup here 👉🏻 bit.ly/3ASvNf6
#GSTCP
I have recently completed an amazing course on "Creating powerful dashboards using Power BI" guided by Deeksha Anand OneStopData with GrowthSchool.
The course covered various important concepts in Data Analysis and Visualization such as:
- Fundamentals of Data Analysis
-Cleaning and Transforming data using Power Query Editor
-Creating relationships between different datasets (data modeling)
-Using different types of visualizations, slicers and filters
-Creating measures using DAX
-Creating a Dashboard that gives meaningful insights about data
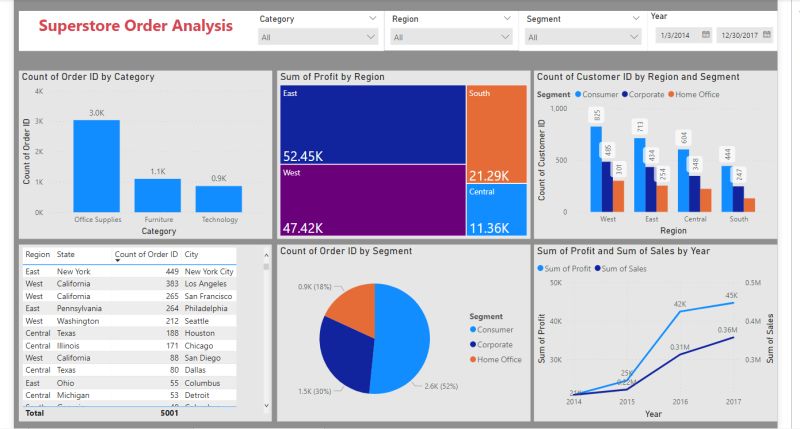
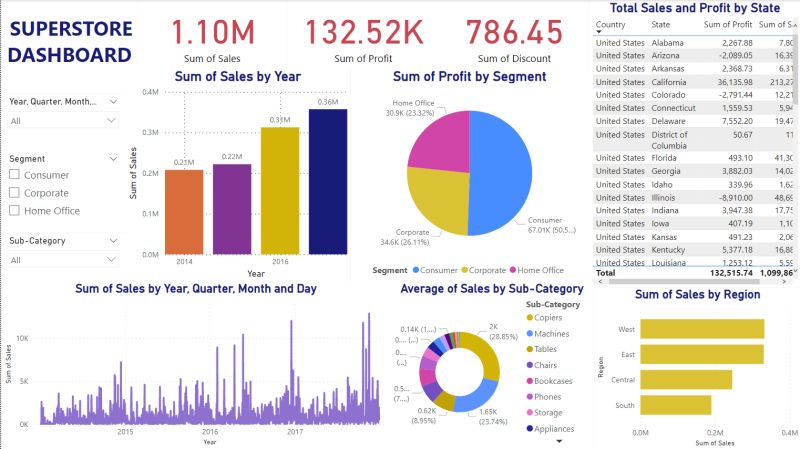
I have created a Superstore Sales dashboard in Power BI using the knowledge gained throughout the course .
Dashboard covers various metrics such as sales, profits and quantity with respect to regions, segments, categories and time period.
Any suggestions or recommendations are welcome.
#gsfellow #powerbi #dataanalysis #learning #datavisualization #growthschool
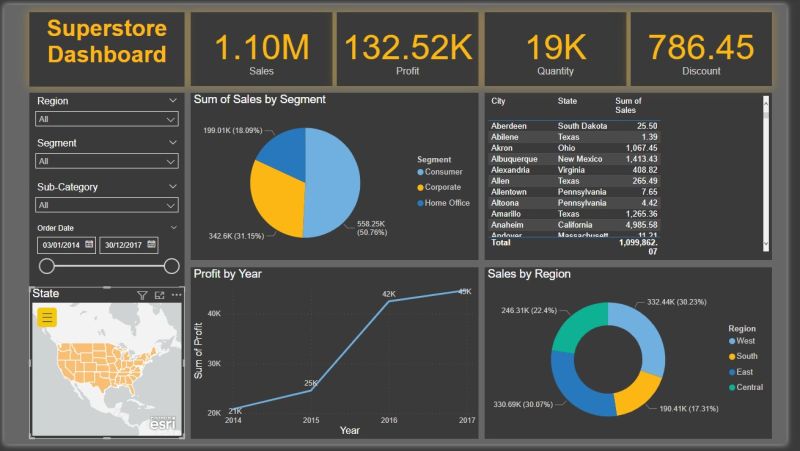
A great start to my career in Data Analytics with my first ever dashboard, I recently completed a crash course on Power BI mentored by Deeksha Anand in association with GrowthSchool and OneStopData.
Here's my visualization on Super Store Data;
Steps involved:
(Supporting Source - Excel Super Store Data sheets)
1. Cleaning and manipulating data using Power Query Editor
2. Appending and merging rows and columns from different excel sheets respectively.
3. Data Modelling connecting 3 co-relating data sets.
4. New measures in DAX
5. Data visualization using visuals and conditional formatting.
Analysis:
1. Created Insights on year on year sales, profits and orders.
2. Analyzed sales based on region, segments and sub categories.
3. Analyzed highest to lowest sold products.
4. Created visuals on profits gained by each segment, categories and sub categories.
5. Visualized profits against sales and cost of the products sold.
Feel free to provide any suggestions on improving this dashboard.
#powerbi #dataanalytics #visualization #onestopdata #growthschool #businessintelligence #analytics

I am happy & excited to share that i will be starting my journey of learning Python from scratch inside Tech Community at @growthschoolio
It's as fun & learning as it can be..
Is this something that interests you?
Signup here 👉🏻 bit.ly/3ASvNf6
#GSTCP

I am happy & excited to share that i will be starting my journey of learning Python from scratch inside Tech Community at @growthschoolio
It's as fun & learning as it can be..
Is this something that interests you?
Signup here 👉🏻 ctt.ec/d8pz1+

2nd Session for the All About Data Analyst w/
@KunaalNaik
We are learning about,
📍Learn to build a Dashboard from Scratch
📍Understand how to build & place KPI's
📍Use basis DAX functions to create metrics or KPI.
📍Tell a story per Business Requirement.

I am happy & excited to share that i will be starting my journey of learning Python from scratch inside Tech Community at @growthschoolio
It's as fun & learning as it can be..
Is this something that interests you?
Signup here 👉🏻 bit.ly/3ASvNf6
#GSTCP

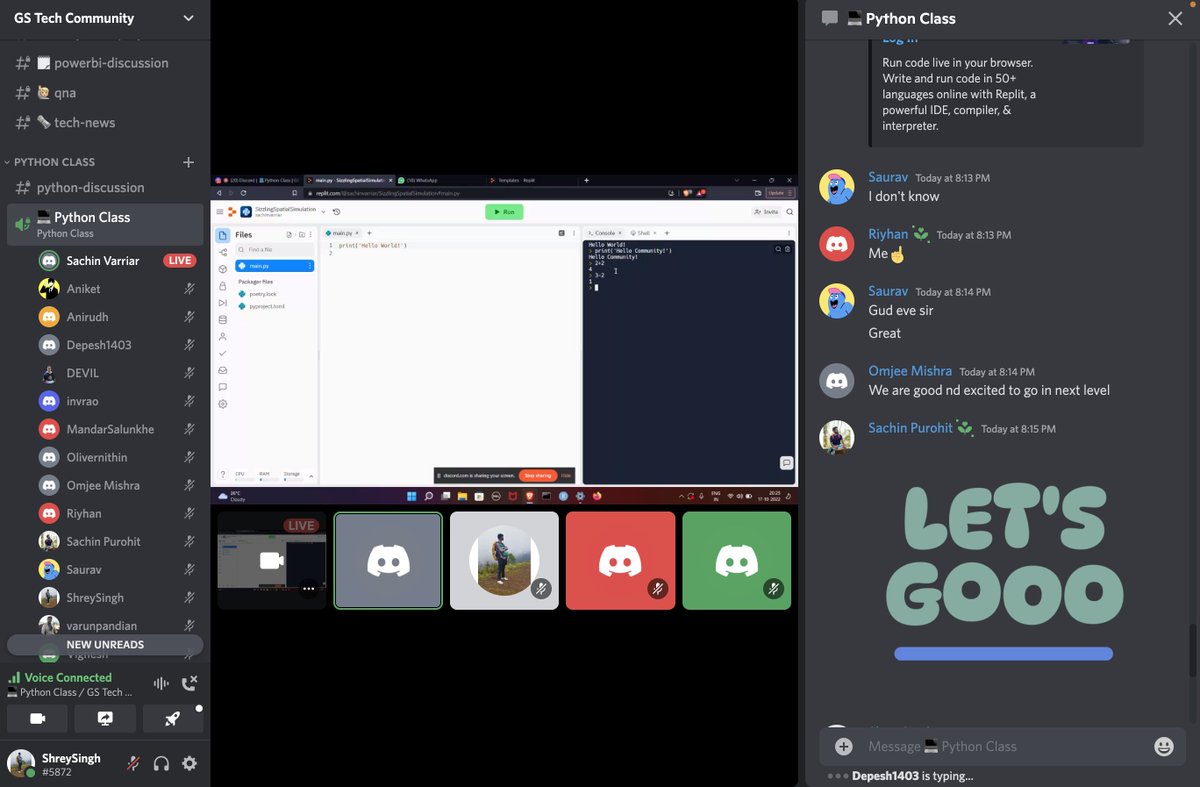
For the First time, We at GrowthSchool Come up with a 4 week Python Project Build Session. w/@sachin_mv
More Than 40 learners joined us today to learn something New
Read the thread to know more about What we Learned Today.
@pinnambharat @VaibhavSisinty
Thread 🧵 1/n

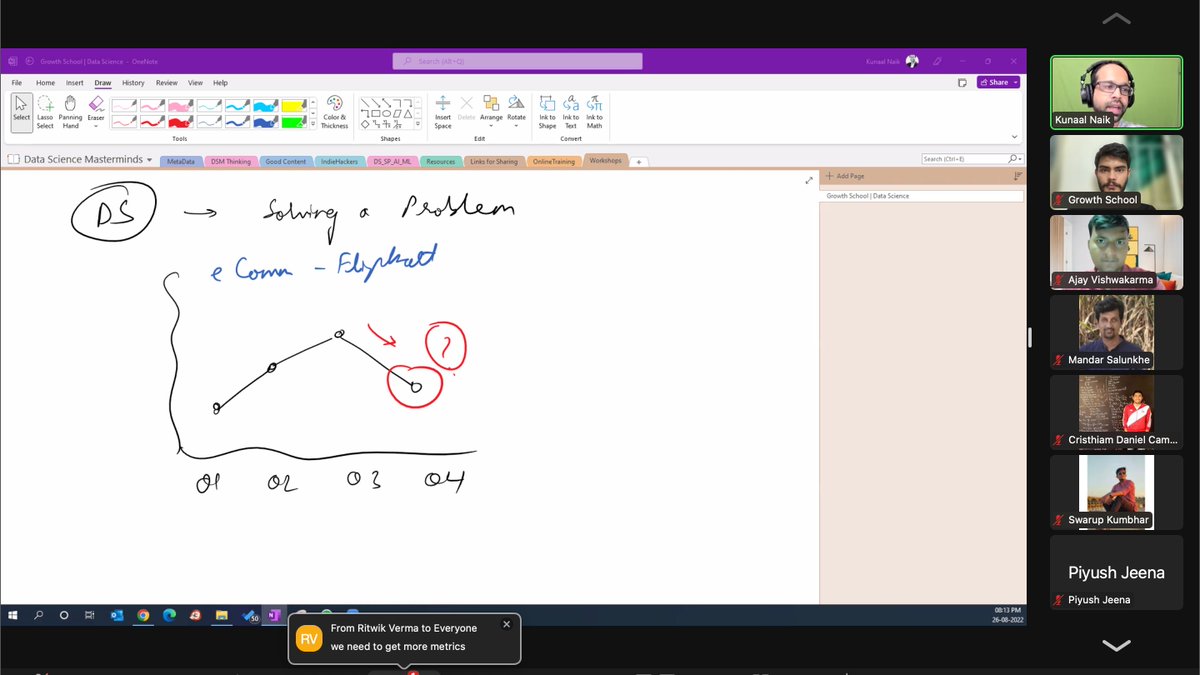
1st Session for the All About Data Science w/
@KunaalNaik
We are learning about,
📌 Basic of Data Science
📌 How to Build good Projects for Data Science Job
📌 How to build an Outstanding portfolio.
Coming up with more exciting sessions w/#community
@VaibhavSisinty

3rd Session for the All About Data Science/Analyst w/@sachin_mv
We are learning about,
📌 How to become a Data Analyst
📌 What Does data Analyst Do?
📌 Do's & Don'ts for Building Project.
@VaibhavSisinty @pinnambharat

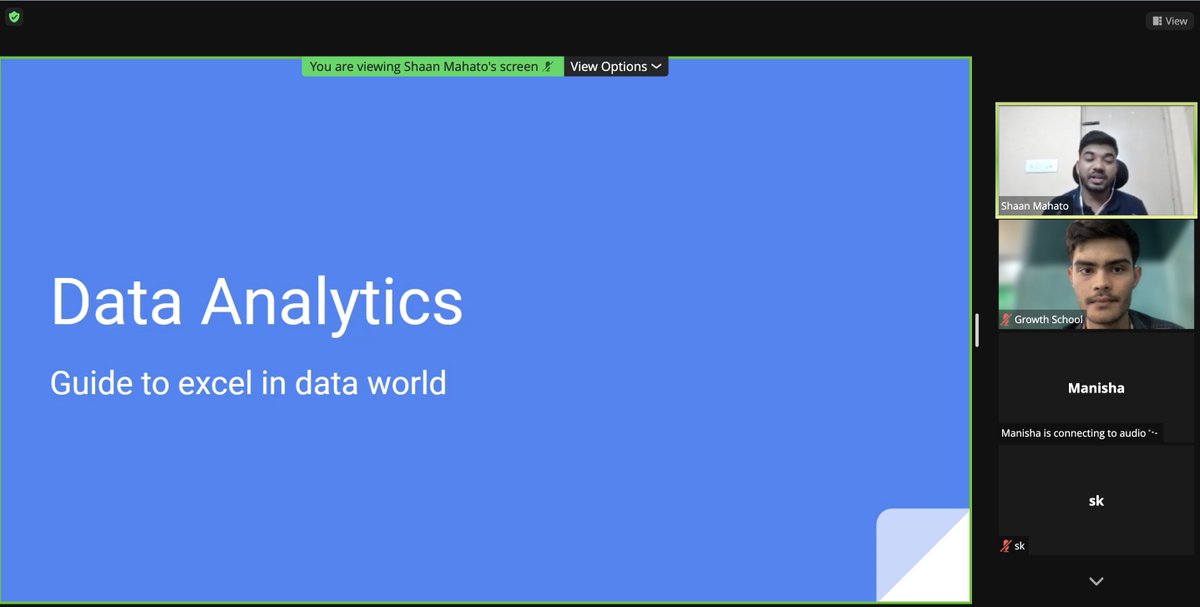
2nd Session for the All About Data Analyst w/
@shaanmahato1
We are learning about,
📌 Basic of Data Analyst & How to Build good Projects
📌 How to build an Outstanding portfolio with the Help of SQL.
Coming up with more exciting sessions w/#community
@VaibhavSisinty

Thank you sachin , shrey singh and growth school. thanks for your time and for conducting this commumity class.I am excited for the next class to learn more good stuff from you.

Having a great experience learning and upskilling myself by doing this Power BI course mentored by Deeksha Anand and powered by GrowthSchool #learning #powerbi #learning #growthschool #gsfellow

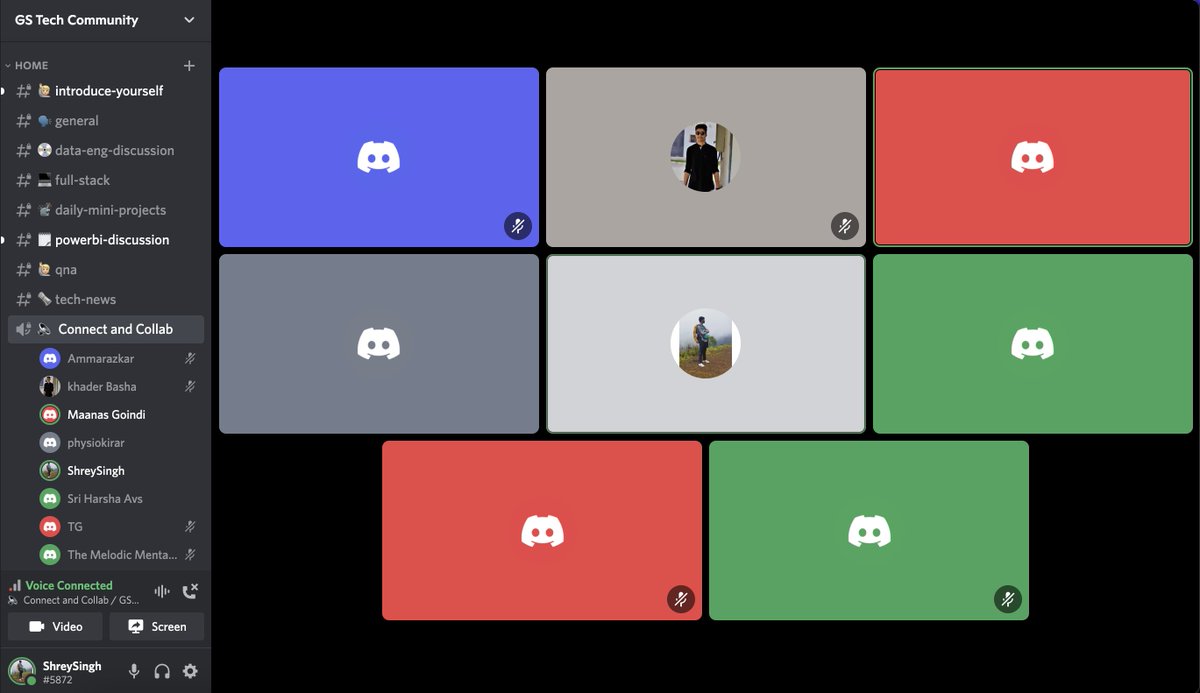
Done with Another very interesting Discord Community Session Around Power-BI🎉
During The Session we talked about
📍What is Power Bi
📍How to learn power Bi
Join Our Tech Community: bit.ly/gstechcommunity
@VaibhavSisinty @pinnambharat
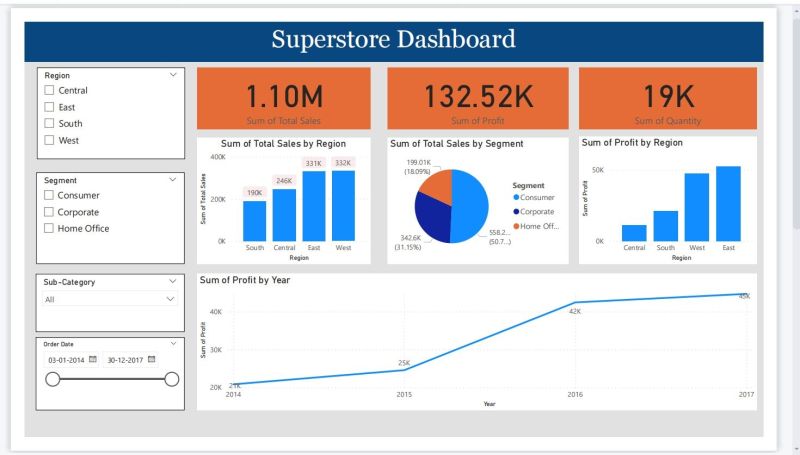
I am so glad to be a part of Deeksha Anand 's Workshop on Power Bi Crash Course powered by GrowthSchool. The course structure is neat and the way Deeksha teaches is so clear that one can understand even without prior knowledge on the BI tool. I've created the dashboard on my Day 2 and received feedback on the same day itself. Thanks a lot for your quick response that I was able to rectify my mistakes quickly
Feedback : My feedback's to reduce the transparency in my background image or change it so that it tweaks the visuals and be more focused on the insights
Fix: I went ahead and used a shape to cover up my entire background, reduced the luminance and finally reattached the background.(Refer the Image that I rectified from the feedback provided) Didn't work out . Modified the background to a solid color
What I learnt from this?
1. Your design should be monotonous
2. Modify Background image and it should be less transparent and not overpowering the significant key metrics and visuals . So that it attracts stakeholder's attention and provides more readability to the data
Let me know your thoughts on this.

Just got this email and this makes me super happy🔥🔥
I am so happy I started educating and mentoring people, seeing them succeed is truly something that gives me so much joy❤️
All my students are very very important for me and seeing them succeed, getting the raise and getting the desired job is what makes my day!
Thankyou all for believing so much in me!!
Follow OneStopData for data related content!
Also super happy to collaborate with GrowthSchool Vaibhav Sisinty ↗️ on the PowerBI course and Rajat Kharbanda ↗️ for creating this with me🔥🔥

Let me guess.
.
.
You were sitting in front of your laptop, wishing to acquire a skill you have always wanted to. You open Youtube, binging on numerous videos, hoping to find "the perfect one".
And, before you even realize, you have shifted to your mini-world of Instagram reels (Ahh, I can feel you!), and now your thumb is screaming to you to finally stop...
Well, I have got your back, and for that you can sneak an eye upon GrowthSchool, which has a well designed series of courses, especially curated for you.
(P.S. : Not a promotional post, I myself have taken a few courses there, and they are legit awesome.)
You can also join the discord server of GrowthSchool Tech community, which has a bunch of experienced people from the tech industry, and you can interact with a lot of like-minded people and have some fun with the interactive games on the server.
You can find the link here:
https://lnkd.in/dQZGfkHt
GrowthSchool Vaibhav Sisinty ↗️ Shrey Singh
P.P.S : It took a whole millenium for me to announce that I am finally skilled at PowerBI to create powerful dashboards, and can't thank enough to Deeksha Anand and OneStopData for being a wonderful mentor and guide in learning the skill.

#dataanalytics #workshop #projectdonebymeonzomato'sdataset Thanks GrowthSchool #workshop Thanks Shubham Jha for the Useful session
These are some of my first dashboards created with PowerBI under the guidance of Deeksha Anand OneStopData GrowthSchool
Hello connections, I very happy to share with you all that I got the opportunity to enrol in the 5-day online workshop on Power BI, conducted by GrowthSchool, guided by the mentor Deeksha Anand, from OneStopData.
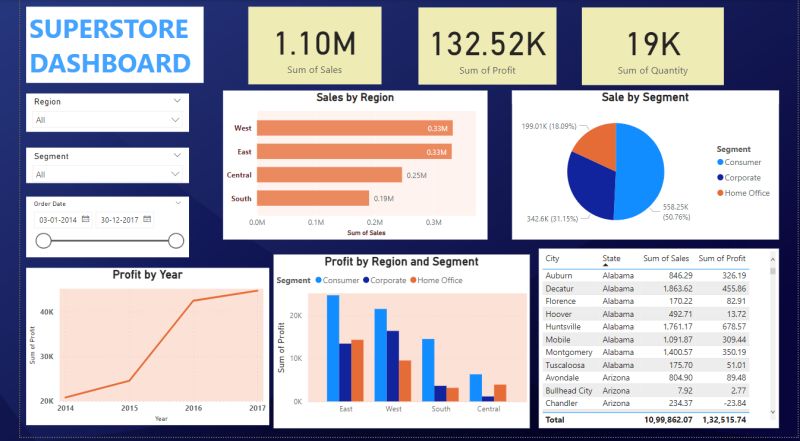
Here is the dashboard that I have created in my day 2, in which Deeksha Anand guided and asked us to create your on questions about the data, and play around with different types of visuals. We are using the Superstore dataset, which is available in Kaggle.
Any valuable feedback should be appreciable!
#powerbi #data

This is my first dashboard created with PowerBI under the guidance of Deeksha Anand OneStopData GrowthSchool
#growthschool #onestopdata #dataanalytics #powerbi

Hello Everyone,
Today Here Ending with the completion of Day 1 Dashboard.
It was being done under the guidance of Deeksha Anand GrowthSchool where I have got the deep insights of data visualization.
It was being a day of actively learning the creation and implementation of different types of data and analyzing them.
The Key takeaways from today's sessions are -
1. Analyzing the data and its outcome.
2. Understanding the different types of visualizations like Filters , Slicers and different types of charts being used to make and understand data more clearly and efficiently.
Excited to continue learning more in the upcoming sessions.
#datavisualization #data #learning #powerbi #powerbidashboard
Hands on power bi under the guidance of Deeksha Anand OneStopData GrowthSchool #powerbi

Hello Everyone,
Here is the Day 1 Dashboard.
I have created during the Growth school 5 days Power Bi session under the guidance of Deeksha Anand OneStopData GrowthSchool
The key takeaways from today's session are:
- Analysing the data and looking for the outcome needed.
- Uses of Slicers, Filters, Scorecards, and Types of charts can be used.
#growthschool #onestopdata #dataanalytics #powerbi

Hello everyone,
This is the Day1 Dashboard, I have created during the Growth School 5 days PowerBI Cohort under the guidance of Deeksha Anand OneStopData GrowthSchool
The key learnings of today's class are:
- Understanding data sets and different visuals in PowerBI.
- Uses of Slicers, column styling, scorecards
- overview of data with visuals
#powerbi #growthschool #data #microsoft #superstore #dashboard

Hi Everyone,
I am elated to share that I've just completed a 5 day Power BI Online workshop, Conducted by GrowthSchool and guided by the mentor Deeksha Anand from OneStopData.
it was a wonderful experience that allowed to develop skills and knowledge of Power BI.
In this 5 Day workshop we have covered:-
1. Fundamentals of Power BI, Using slicers and Filters , Visualisation of Power BI.
2. Clearning and Modifying Data Sets, Transforming Data, Power Editor Query, Relationship Creation and Using DAX Language.
3.Advanced BI Concepts of Conditional Formatting, New measure using DAX Language and Publishing the Report.
By the end of this workshop I am able to create a powerful dashboard for a Superstore (For which dataset has been taken from Kaggle, A popular platform for Data science).
Thanks to Deeksha Anand and GrowthSchool team 🙌
#powerbidashboard #powerbi #dataanalytics #datascience #datascientist #kaggle #team #publishing #language #experience #share #data

Hi All
I almost finished 5-Day PowerBI crash course/workshop organized by GrowthSchool, it was led by Deeksha Anand founder of OneStopData.. It was one of amazing workshops I have attended in recent times. It was such well organized, right from easy of registration, onboarding, course content, Instructor expertise, easy-to-use LMS, constant communication on events/assignments from organizers and community assistance via Discord etc.
Course is very nicely organized to cover all important topics at high level, Deeksha Anand is a great instructor and explains concepts in layman's terms considering there are beginners too. She encourages hands-on all the time.
Key learnings from the course:
(Though I have worked in tableau, so it was comparatively easy to grasp majority of concepts for me)
📝 What is BI and use cases for powerBI
📝 Data analysis and visualization using various graphs
📝 Effectiveness of storytelling and suitable dashboard designs
📝 Data Cleaning and transformations using Power Query Editor
📝 Combining tables, defining relationships
📝 Using DAX language to create custom measures etc
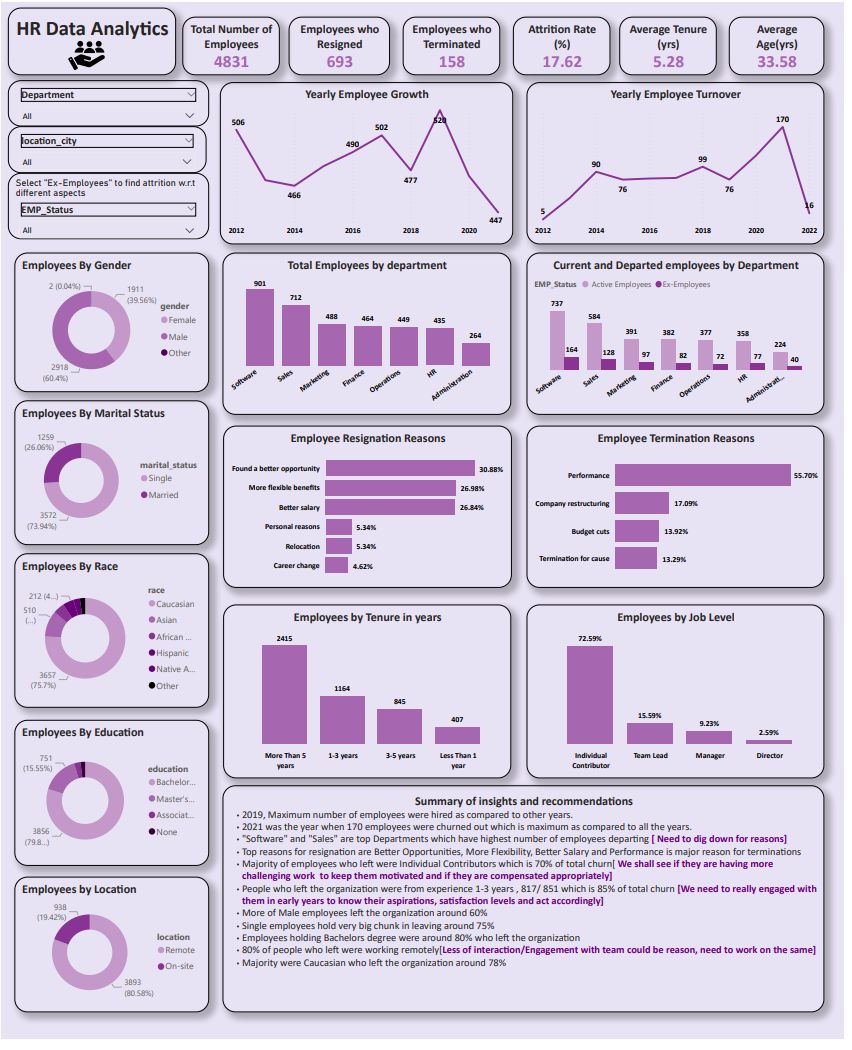
As part of Final assignment, I chose to do a project on HR Data Analytics and took Employees data for a fake company and tried to analyze overall diversity of employees in terms of experience, race, expertise, gender, job-level etc and also attrition trends. Dashboard was made in very short time due to tight timelines, there is a lot of scope in the project which I will take it further after the course :) and definitely add it in my portfolio.
I have used:
📝Power Query editor to change data types of some columns, make new columns
📝 DAX language to define some of custom measure like people who resigned and people who were terminated etc
📝 Also, seems we don't have histogram available readily in powerBI, I learnt a method and tried to implement the same
I am very much satisfied with the workshop and gave me very solid understanding about basics of PowerBi which I can use to further explore the tool.
I would really recommend the course whosoever wants to try hands on PowerBi and also would look for other courses by GrowthSchool.
You guys are doing amazing by offering such important courses and that too at very affordable rates, keep doing the good work.
#hranalytics #powerbi #alwayslearning

This is my first attempt at making a dashboard using Power BI. The workshop was very insightful. Had a lot of fun experimenting in Power BI. Most of things that I have done in my dashboard are the things I learnt from the recorded lectures. Thank you. Deeksha Anand OneStopData GrowthSchool #powerbi #growthschool #onestopdata